
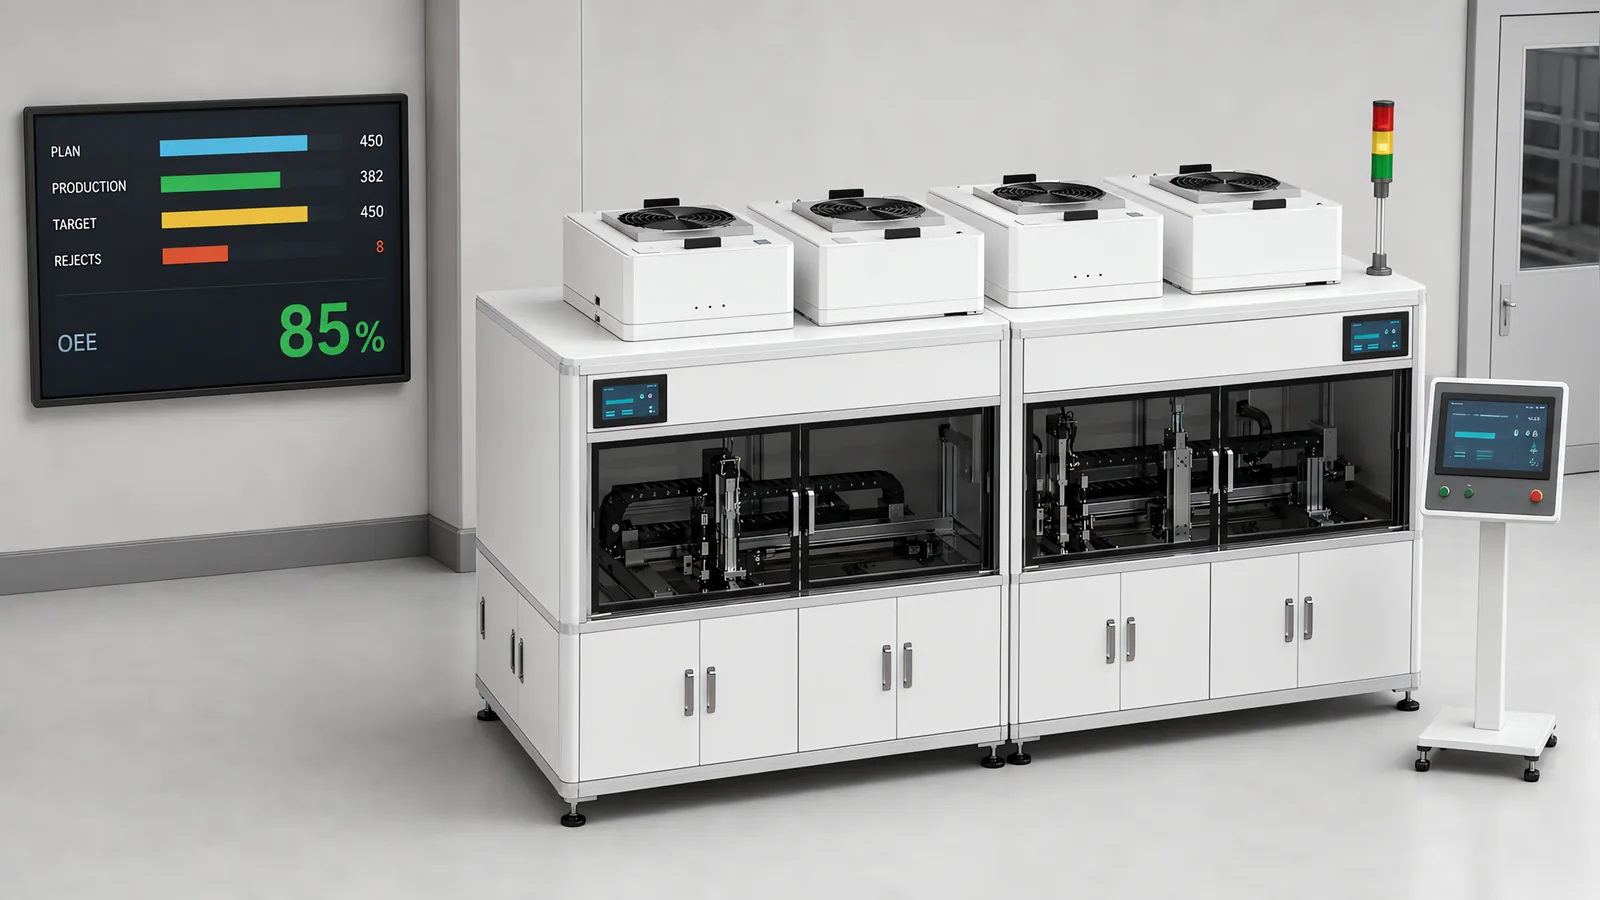
OEE (Overall Equipment Effectiveness) measures the share of planned production time used to make first-pass good parts at the ideal cycle time. OEE = Availability × Performance × Quality. The worked example below gives 65% OEE and shows which loss contributes most. To make that number useful on your own machine, define the production window, cycle time and part counters consistently.
Motionwell builds custom machines and retrofits control systems in Singapore, including the sensors and counters that feed production dashboards. This guide covers the machine side of OEE: where each signal comes from, how to check the calculation and which engineering changes address the measured losses.
What Is OEE in Manufacturing?
OEE is one percentage that answers a narrow question: of the time you planned to produce, how much did you spend producing good parts at the speed the machine is capable of?
It compresses three separate failures into one score.
- Availability: the machine was supposed to be running and was not. Breakdowns, changeovers, material starvation, waiting for an operator.
- Performance: the machine was running, but slower than its rated cycle. Micro-stops, jams cleared in ten seconds, reduced speed settings, feeder hesitation.
- Quality: the machine was running at speed, but produced parts you cannot ship. Rejects, rework, startup scrap after a changeover.
Those are the Six Big Losses from TPM literature: breakdowns and setup/adjustment under Availability, idling/minor stoppages and reduced speed under Performance, process defects and startup losses under Quality. The categories matter more than the label, because they tell you who owns the fix.
The OEE Formula
Availability = Run Time / Planned Production Time
Performance  = (Ideal Cycle Time x Total Count) / Run Time
Quality      = Good Count / Total Count

OEE = Availability x Performance x Quality
Planned Production Time is the time scheduled for production. Exclude periods when production was not planned, such as an unstaffed shift. Count changeovers and other stops within the planned production window as Availability losses. These definitions follow the OEE calculation method from Vorne. TEEP uses all calendar time and answers a broader capacity-utilisation question.
A Worked OEE Calculation
One shift, one machine. Illustrative figures.
| Input | Value |
|---|---|
| Shift length | 480 min |
| Scheduled breaks with no production planned | 30 min |
| Planned production time | 450 min |
| Stops within planned production, including changeover | 60 min |
| Run time | 390 min |
| Ideal cycle time | 15 sec/part |
| Total count | 1,200 parts |
| Good count | 1,170 parts |
Availability = 390 / 450 = 86.7% Performance = (15 x 1,200) / (390 x 60) = 18,000 / 23,400 = 76.9% Quality = 1,170 / 1,200 = 97.5%
OEE = 0.867 x 0.769 x 0.975 = 65.0%
The shortcut is good count × ideal cycle time / planned production time: (1,170 × 15) / 27,000 = 65.0%. Both methods should agree before rounding. If they differ, check units, time windows and count definitions. In this example, the 30-minute break sits outside planned production; changeover time stays within the 60 minutes of stops.
On a rotary indexing machine, the index period includes the slowest station’s dwell plus index and settling time. Convert that period to seconds per part by dividing by the number of completed parts discharged per index. A multi-cavity dial can produce several parts per index. Establish the ideal value for each product during process trials, using the same unit as the output counter. Our rotary assembly machine design guide explains station balance and index timing.
Where Does OEE Data Actually Come From?
OEE needs three reliable inputs from the machine: run and stop time, total output, and first-pass good output. Older equipment may need additional sensing or PLC data collection to supply them.
Availability: Run Time and Stop Reasons
Run time is not “power on”. A machine can sit energised, in cycle-stop, for a whole shift. What you need is a state signal the PLC already holds, auto-mode, cycle-active, or index-drive-enabled, sampled and timestamped.
Map the PLC’s alarms and interlocks to stop reasons: E-stop activation, an open guard, an empty upstream buffer or a drive fault. Record the first relevant event as well as the resulting machine state. Operators can then add context for stops the controls cannot identify, such as waiting for material or a quality decision.
On our control-system retrofits, we can define the loss categories while rebuilding the alarm structure. This puts the data collection, HMI explanation and controller logic into the same design and test plan.
Performance: Counts and the Ideal Cycle Time
Total count records completed parts, including accepted and rejected output, at defined counting points after the relevant process. Reconcile separate good and reject outlets and avoid double-counting rework. An index counter needs occupancy and parts-per-index logic; an empty nest or a reject-gate movement alone is not a completed-part count.
Ideal cycle time is where OEE gets manipulated most often. Three definitions compete:
- The machine’s design cycle, meaning what it was engineered to do.
- The best sustained cycle ever observed for that product.
- Whatever the current recipe happens to be set to.
Only the first two are defensible. Using the current recipe speed makes Performance read near 100% forever and hides the reduced-speed loss entirely: the machine has been slowed to a comfortable pace, and the metric applauds it. If a machine has several products with different cycles, ideal cycle time is per product, and the calculation has to be split by run.
Quality: Good Count Versus Total Count
Good count means first-pass good. Parts reworked and later passed do not count. That distinction is unpopular, and it is the whole point of the factor.
The cleanest source is the inspection station itself. Where we integrate inline vision, the camera controller already produces a pass/fail verdict per part plus a defect classification, so good count, reject count and reject reason arrive as one dataset. On a packaging line running serialization, the code reader’s grade failures are already counted for compliance, and that count is your quality loss data too. How those systems are specified and lit is covered in our machine vision inspection guide.
Where inspection is offline, the data arrives hours late and disconnected from the machine state that caused it.
Five Checks Before You Trust an OEE Report
Check these definitions before using the report to justify a machine change.
The ideal cycle time was set to the current speed. Performance reads 95%+ permanently. A common way to make a dashboard look good.
Micro-stops disappear. Most collectors only log a stop past a threshold, often 60 seconds. A jam cleared in 15 seconds, forty times a shift, vanishes from Availability and reappears as a Performance shortfall nobody can locate. Set the threshold low, then aggregate.
Planned downtime absorbs everything inconvenient. Reclassify a slow changeover as planned maintenance and Availability improves with no physical change. Draw the line once and stop moving it.
Rework counts as good. Quality reads 99% while the rework bench is stacked.
The dashboard takes a simple average across products. Different ideal cycles and run lengths need appropriate weighting. Calculate each product run first. For an overall period, divide the sum of first-pass good output × its ideal cycle time by the total planned production time.
Choose the measurement point around the production constraint. Improving a downstream station helps output only if the rest of the process can supply and accept that rate. Start with the bottleneck and use upstream and downstream states to explain its losses.
The machine monitoring system guide turns these checks into a state dictionary and shift-reconciliation trial. Include a counter reset and communication outage so that missing observations cannot silently become downtime or additional output.
Production-state definitions also matter when preparing AI data. manufacturing AI data context retains recipe, state and outcome labels instead of treating every tag as equivalent.
What Is a Good OEE Score?
85% is a widely used reference in discrete manufacturing. The more useful production target starts with your product mix, changeover pattern and current losses. Establish a baseline using consistent definitions, then set improvement targets for the losses that reduce saleable output.
Context changes how to interpret the result:
| Situation | What to expect |
|---|---|
| Single product, long runs, no changeover | High Availability, benchmark is meaningful |
| High-mix, frequent format changes | Availability structurally lower; measure changeover separately |
| GMP or validated production | Cleaning, line clearance and batch documentation are non-negotiable time |
| Manual load / unload stations | Performance tracks operator pace |
| New line still ramping | Startup losses dominate; do not benchmark yet |
A filling line with frequent cleaning between batches may record lower Availability than a long-run assembly machine. Compare like-for-like runs over time, and include product mix and scheduled production time when comparing lines.
How Do You Improve OEE?
Use the three factors to locate losses, then rank changes by recoverable bottleneck time, first-pass good output and implementation cost. The lowest factor is a useful place to investigate, but the largest percentage gap may not offer the best production return.
Raising Availability
If changeover is a major loss, examine both the mechanical adjustments and the preparation sequence. Tool-free format parts, keyed fixtures and stored recipes can reduce setting and checking time. On our filling and sealing machine, container format is carried in machined tray sets; the custom filling machines page covers how that is specified.
Unplanned stops need failure data before a fix. Drives that already report motor current, temperature and fault history turn “it stopped again” into a repeat-cause list. Bearings, feeders and grippers are the usual offenders.
Repeated protective stops deserve a layout and task review. Loading access, conveyor crossings and cleaning tasks should be considered in the risk assessment. Safeguarding changes can include revised access points, suitable muting sequences or monitored reduced-speed operation, with the safety functions validated for that application. Cobot safety standards covers the collaborative case.
Material starvation is not a machine fault, but it lands on the machine’s OEE. The four-year QA lab automation programme we run with AMRs, a cobot and server-based task scheduling exists largely to keep instruments fed without a technician standing there.
Raising Performance
Micro-stops first, because they stay invisible until you log them. Record every stop over one second with its trigger sensor, run it a week, sort by frequency. The list is usually short and boring: one feeder escapement, one gripper losing a particular part orientation, one sensor mounted where it catches a reflection.
Feeding is the classic assembly bottleneck. Vibratory bowls with escapements sized for the part, correct track geometry, orientation verification before the pick. A feeder that presents a wrong-way part every fiftieth cycle costs more than it looks like it should.
Reduced-speed running is worth investigating. Machines get slowed for a reason, usually one station that could not hold tolerance at rated speed. Fix that station and the line goes back up.
Raising Quality
Place inspection close to the operation that can create the defect. On a rotary machine, intermediate checks can reject or flag a part before further components are added, while final inspection confirms the completed assembly.
Then measure the process as well as the outcome. Force-monitored insertion with per-cycle logging tells you a press station is drifting before it produces rejects. A thickness gauge built around a displacement sensor does the same thing for a dimension, because it reports a number, and a number can be trended toward a limit while a verdict only tells you after the part is already scrap. Leak-test fixtures earn their place on the same argument: a pressure decay curve moves before it crosses the reject threshold.
Startup scrap after changeover is a Quality loss with an Availability cause. Recipe-driven setup with stored parameters, plus a first-article check inside the sequence, shortens it.
How Do You Get OEE Data Off a Machine That Was Never Instrumented?
For a machine without usable production data, compare three collection routes against the controller, required detail and available shutdown window:
-
Bolt-on sensing. Add discrete sensors and a small edge controller to collect run state and counts independently of the original program. Verify the new measurement chain and assess the installation’s impact on machine operation. Additional inputs or operator reason codes can provide stop context.
-
Read the existing PLC. A supported communications interface can expose existing state, alarm and count tags. Check controller capacity, polling load and network access, then test any additional collection logic with the machine.
-
Control-system retrofit. Replace the PLC, drives and HMI on a mechanically sound machine. The mechanics stay, the controls become current, the data structure is designed in. This is now the largest single line of work we do, and the instrumentation is a small addition to a project already justified on obsolescence risk.
Where the data goes afterwards follows the same design sequence as any machine project, described in special purpose machine design. The electronic device history record platform we deliver to a medical device OEM is this problem under regulatory constraints, every parameter attributable and retained, which is what 21 CFR Part 11 asks of any record a predicate rule already requires.
What Should You Bring When You Want This Measured?
Useful OEE combines clear production definitions, reliable machine signals and a report that points to a practical change. To scope data collection on a specific machine, bring:
- The machine’s control platform: PLC make and model, drive types, HMI, and whether program source is available.
- The design cycle time per product, and the products currently run on it.
- Your current stop-reason list, even if it is a paper log or a whiteboard.
- Where quality is judged today, inline, at a bench, or at final inspection, and who records it.
- What you believe the bottleneck is, and why.
We can review the loss definitions and signals, then scope additional sensors, a PLC connection or a control retrofit. A short manual logging exercise can help identify the measurement points before hardware is selected.
Talk to a Motionwell engineer with those five items and we can scope it from there.