
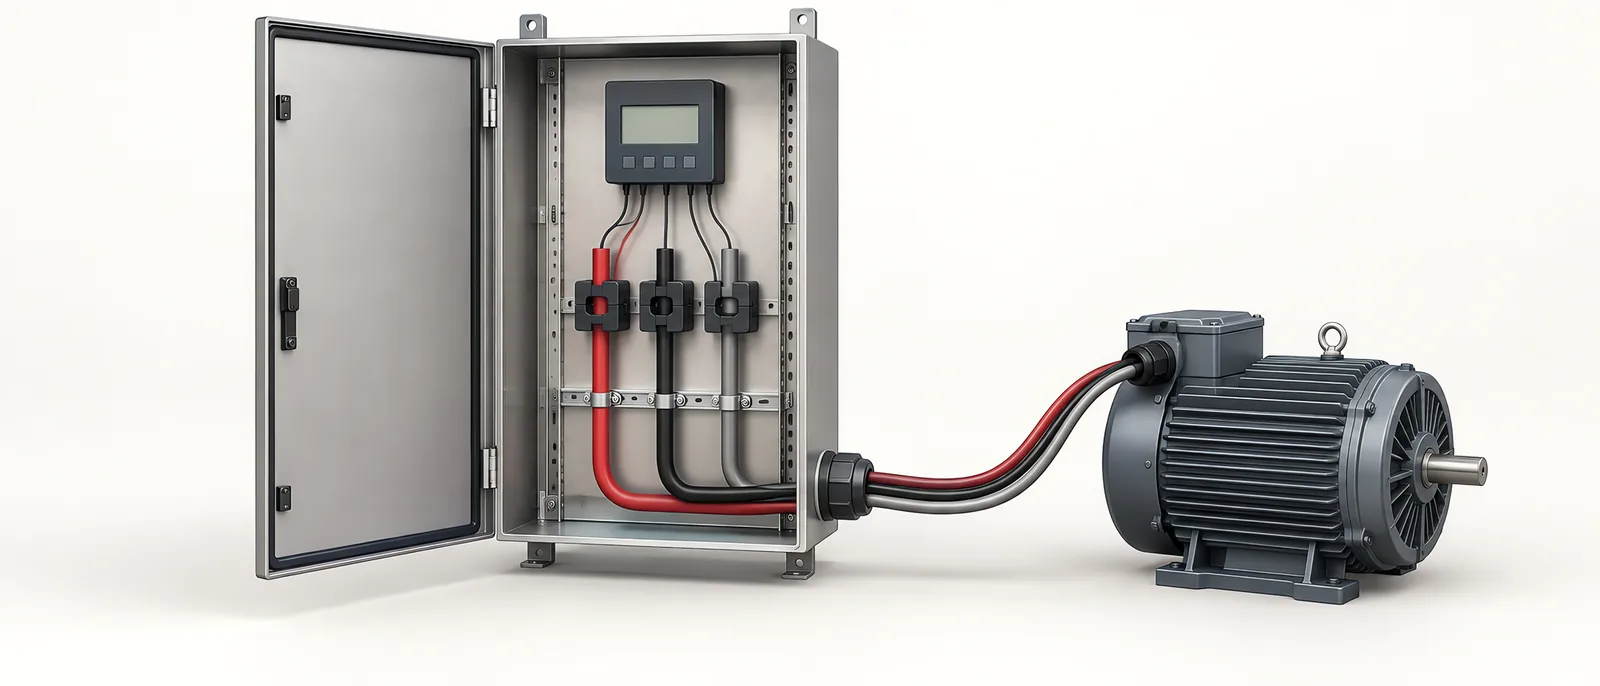
Conceptual equipment illustration.
Industrial energy monitoring begins with a measurement boundary. Decide whether the figure represents one machine, a production line or a shared utility, then connect its energy use to the operating conditions inside that boundary.
A current trend alone is not an active-energy measurement. Use equipment and a measurement arrangement suited to the electrical system and the quantities required, then verify how those quantities reach the reporting system.
Draw the Boundary on the Electrical Layout
Identify every included load. A line total may include process equipment, conveyors and local auxiliaries while excluding a central compressor or chiller. That boundary can still be useful, but it must remain consistent when comparing periods.
Show shared loads separately. If their consumption is allocated across lines, retain the allocation method alongside the directly measured values. Do not present an estimated share as a dedicated meter reading.
This review fits into control-panel design and build, where meter placement, access and the installation arrangement can be considered together.
Verify the Measurement Configuration
The selected meter must match the supply arrangement and any current or voltage transformers. Transformer ratios and the configured electrical system affect how measured inputs are converted to reported values.
Schneider Electric’s PM2225C metering setup identifies these configuration parameters. Use the documentation for the actual meter and sensors when checking the installation and commissioning record.
| Check | Why it matters to the report |
|---|---|
| Meter boundary | Establishes which equipment contributed to the total |
| Sensor and ratio configuration | Establishes the scale of the reported quantity |
| Units and register meaning | Distinguishes power, energy and other electrical values |
| Time interval | Makes comparisons refer to the same period |
| Data quality | Identifies gaps, resets and invalid readings |
Electrical installation and testing belong in the planned machine work, with the circuit and measurement arrangement reviewed before commissioning.
Add Production Context
Record whether the line was producing, waiting, changing format or stopped. An energy rise may accompany more accepted production; a lower total may simply reflect less running time.
A useful operational measure is:
Energy per accepted unit = measured energy over the period ÷ accepted units over the same period.
For an illustrative period using 240 kWh and producing 1,200 accepted units, the result is 0.20 kWh per accepted unit. The calculation describes that boundary and period. It does not include unmetered shared utilities unless they have been added explicitly.
When output is zero, report the idle-period energy directly. Do not divide by zero or make the period disappear from the analysis.
Reconcile Meter and Historian Values
Follow a known interval from the meter display or logged readings to the reporting system. Verify scaling, timestamp interpretation and cumulative-counter handling. Test a communication interruption and a meter reset.
The legacy-machine connectivity guide covers the data route. An HMI or SCADA integration should show the measurement unit and quality state, not just a number on a chart.
Compare Like Operating Conditions
Review similar products, production rates and auxiliary loads before attributing a change to an improvement. Keep raw energy totals available alongside normalized figures so that a favourable ratio does not hide increased total consumption.
Use the initial record to identify questions for investigation: persistent idle load, an auxiliary that remains active after production stops, or a change in energy per accepted unit. Confirm the cause before assigning a saving to a proposed modification.
Discuss industrial energy monitoring within a machine retrofit or contact Motionwell about your production line.